Tether cars were popular before the invent of radio control, and were held within a circular track using a wire tether. Often the cars are timed manually, but I wanted an automatic display, which would show the lap speed, in MPH
A sensor is fitted to the central pivot, so as the wire rotates round, a pulse is sent to the speedometer, once per lap.
The speedometer uses a microcontroller to sense the time between switch triggers. This is converted to a speed (in MPH) and displayed on four 7-segment displays. Effectively there are 4 hardware components in the design,
- the microcontroller (to time the lap and work out the speed),
- the display (to show the speed)
- the voltage regulator (to power the circuits from a battery)
- the switch (to trigger once per lap)
The microcontroller
The speedometer is built around the Arduino Nano. These can be purchased very cheaply, and have nearly all the features you’d want, but on a very small footprint. Programming is very simple, using the Arduino IDE software, connected to a pc using the on-board USB Mini port. However, above all, the availability of sample code makes the Arduino system ideal for non-programmers like me.
I prefer the footprint of the nano, as the pin spacing fits fine on the standard 0.1” pitch Veroboard. The Uno (the original Arduino board) has a frustrating gap between the headers, which isn’t a multiple of 0.1”, and therefore makes placement on Veroboard awkward).
The display
The 7-segment displays are 6 inches high, which are available from Sparkfun, who also supply driver boards. These driver boards include a shift-register IC, with breakout terminals allowing the boards to be soldered directly to the 7-segment display. Thanks to the use of the shift registers, and some clever coding (all supplied by Sparkfun), only six terminals are required – two positive voltage supplies, a ground, and three terminals for the data bus. These can be daisy-chained together, for multiple digits. This means all 4 digits can be controlled with only 3 output pins on the Arduino, rather than 32 if one was to control each segment separately. I’m sure the displays were a bit on the pricy side; however the benefit of Sparkfun products is that instruction tutorials are given – providing not only the wiring diagram, but also sample codes, and details of what other components are required to get it to work
Power supply
The 7-segment display drivers require a 12v and 5v supply. The intention was to use a lead acid battery for the 12v supply, however this would be a little over 12v, so was regulated using a 3-pin regulator. All regulators have a dropout voltage, and since a fully charged battery isn’t much over 12v, it was desirable to select the LM2940CT-12, which had a lower dropout, and a good current capacity (1 amp).
The Arduino Nano includes an on-board regulator, with the V-in pin being happy with this 12v input. The Arduino Nano has a 5v pin, which, as well as being used for the switch circuit, was also used as the second supply for the 7-segment display drivers.
A bridge rectifier was used, albeit only one diode of it, to protect the circuit from reverse polarity, should the battery terminals be reversed.
Switch
The final element of the speedometer was the switch, used to send a pulse to the Arduino – once per lap. For testing purposes I used a tactile button switch
The initial plan was to use a micro switch, however, prior to making the speedometer it was found even small resistances to the tether pivot could jerk the line, upset the car and potentially spin it inwards and off the track. Therefore I ordered some Hall Effect sensors.
I had previously used one on my rain gauge, as part of my dissertation project at University. This was a tipping bucket gauge. As the bucket filled, to the point of the bucket tipping, a magnet was passed by a hall effect sensor, triggering an Arduino Nano and writing the time interval to an SD card. No need to go into further detail, but essentially this hall effect sensor sat in a damp bucket for months, often at sub-zero temperatures, whilst offering a switching method with absolutely no friction or resistance. Seemed good enough for this project, then!
The hall effect sensor needs a 5v and ground connection, as well as the output. So I needed to make a few tweaks to the board. A second wire was soldered in, with the output pin going to D3 – another of Arduino’s Interrupt pins
Code
Various websites and help files made coding the Arduino an easier process than expected. A summary of the program is given below. The Arduino is programmed using the open-source Arduino IDE software.
- The pins are defined, as well as their respective modes (i.e. input and output). Pins D2 and D3 are set as an interrupt pin, which triggers an interrupt when a rising or falling edge is detected (i.e. the button is pressed, or the Hall Effect sensor triggered). More on that later.Digital pins 5 to 7 are set as Output pins, and are defined as the clock, latch and data pins, for the 7 segment displays. Lots of variables are defined. The values aren’t really important.
- The loop function continuously calculates the speed, by dividing the lap distance (40 metres) by the time per lap (variable “timeForLast”). At the same time, the speed is converted into MPH, whilst also multiplying it by 100, to avoid the need to work with decimal values later on, whilst maintaining some precision. If() statements are used to determine whether the speed (referred in the code as lapSpeed) is more than 9999. If that’s the case, the car is travelling at more than 100mph, and therefore, the decimal needs to be displayed one digit to the right. In order to do this, I created a variable, which is either set to 0 or 1. When the variable lapSpeed is more than 9999, the condition of the if() command (“if(lapSpeed>9999)”) is met. The lapSpeed is divided by 10, and the value of decimalPoint is set to 1. Otherwise, the value for lapSpeed is left alone, and the value for lapSpeed is set to 0. For debugging purposes I also had some serial.print commands, so I could see the values on my PC screen, for debugging purposes.
- Now the code posts the value for speed to the displays. This is done by calling the function “showNumber(lapSpeed)”. This starts the showNumber function, with “LapSpeed” as the variable. The “showNumber” function is a piece of code provided by SparkFun, but with a few tweaks by me to get it to behave as intended. This function from Sparkfun is clever as it posts the values of the 4 digits in the format of a serial input, to the DAT pin of the first driver. Out of the box, the showNumber function uses a For loop to cycle through the 4 digits, repetitively dividing the speed by 10 and using the remainder to find the value for the next digit. This then calls the function “postNumber(remainder, true)”, where “true” is set to either true or false, depending on whether the decimal point is to be displayed. I removed the For loop, and opted to call postNumber one digit at a time, even if it was a bit clunky. This meant I could set the decimal point high or low, depending on whether I wished to show the speed to the nearest 10th or 100th of a MPH. To do this, I used “IF” to determine whether the value of decimalPoint was previously set to 1 or 0. If it was zero, I had a speed of less than 100mph, and the second decimal from the left was displayed. If it was 1, the third from the left would show. This was done by selectively repetitively calling the postNumber() function, using the appropriate True or False variables. Much of this was trial and error, admittedly.
- The postNumber function is as-supplied by SparkFun. There was no need to change it. Effectively when the command is called, it uses the switch command to determine how a number would be represented as a stream of high and low pulses. Likewise if the decimal point needs to be on. The data pin is switched high and low, depending on whether a segment needs to be on or off, and the value on the data pin is held in the storage register by a rising edge of the clock pin. This continues for all 8 segments, with a binary number held in the shift register. By repeatedly calling postNumber (as in step 3 above), the data in the first shift register overflows, and is passed from the serial-out pin of the first shift register, and onto the second. Similarly the second shift register overflows into the third, and from the third into the forth. This means all 4 shift registers have been fed a stream of high and low pulses (i.e. serial data), representing which segments to turn on.
- The postNumber() function returns to the earlier showNumber() function (step 3 above) and as per the original Sparkfun code, the latch pin was set low then high, effectively telling the shift registers on the driver boards to push the stored data to the parallel output pins – and therefore illuminate the individual segments of the display.
- The showNumber function returns to the main loop, and the cycle continues as per step 2 above. However, at no point has the speed been calculated or measured. Nor, other than initially declaring the variable, has the speed been set a proper value. This is why the interrupt pin has been used. The interrupt pin, when a rising edge is detected, i.e. the switch is closed, triggers the Interrupt service routine (ISR). This function is called “timeSince()” and operates each time a rising edge is detected on pin D2. The function is also called, on later versions of the code, by a falling edge on D3. This allowed the use of a hall effect sensor. This ISR operates as a priority, and stops all other operations until it’s completed. Here, the time taken for the lap to complete is calculated. This is done using Millis() (a timer which starts at the instant the Arduino turns on) and 2 variables – “timeForLast” and “timeAtPrevLap”. The former variable is the lap duration, and the latter is the time since the button was last pressed, initially set to some arbitrary value. timeForLast is calculated by taking the result of the command “millis()”, and subtracting the variable “timeAtPrevLap”. Once the timeForLast lap has been calculated, “timeAtPrevLap” is updated and given the current value of millis(). This means, the very first value of “timeForLast”, is likely to be nonsense, as the time the start of the first lap has not been set using the onboard timer and therefore is likely some arbitrary value. However on the second call of the ISR, the value for “timeAtPrevLap” had been set correctly by the last time the ISR was called, and therefore the lap time is a true representation of how long the lap took.
- With a value for timeForLast successfully set, the programme returns to loop() – the main body of the programme (step 2 above)
Prototyping
The voltage regulator circuit was constructed first, and checked to ensure a regulated 12v was fed into the Arduino Vin pin.
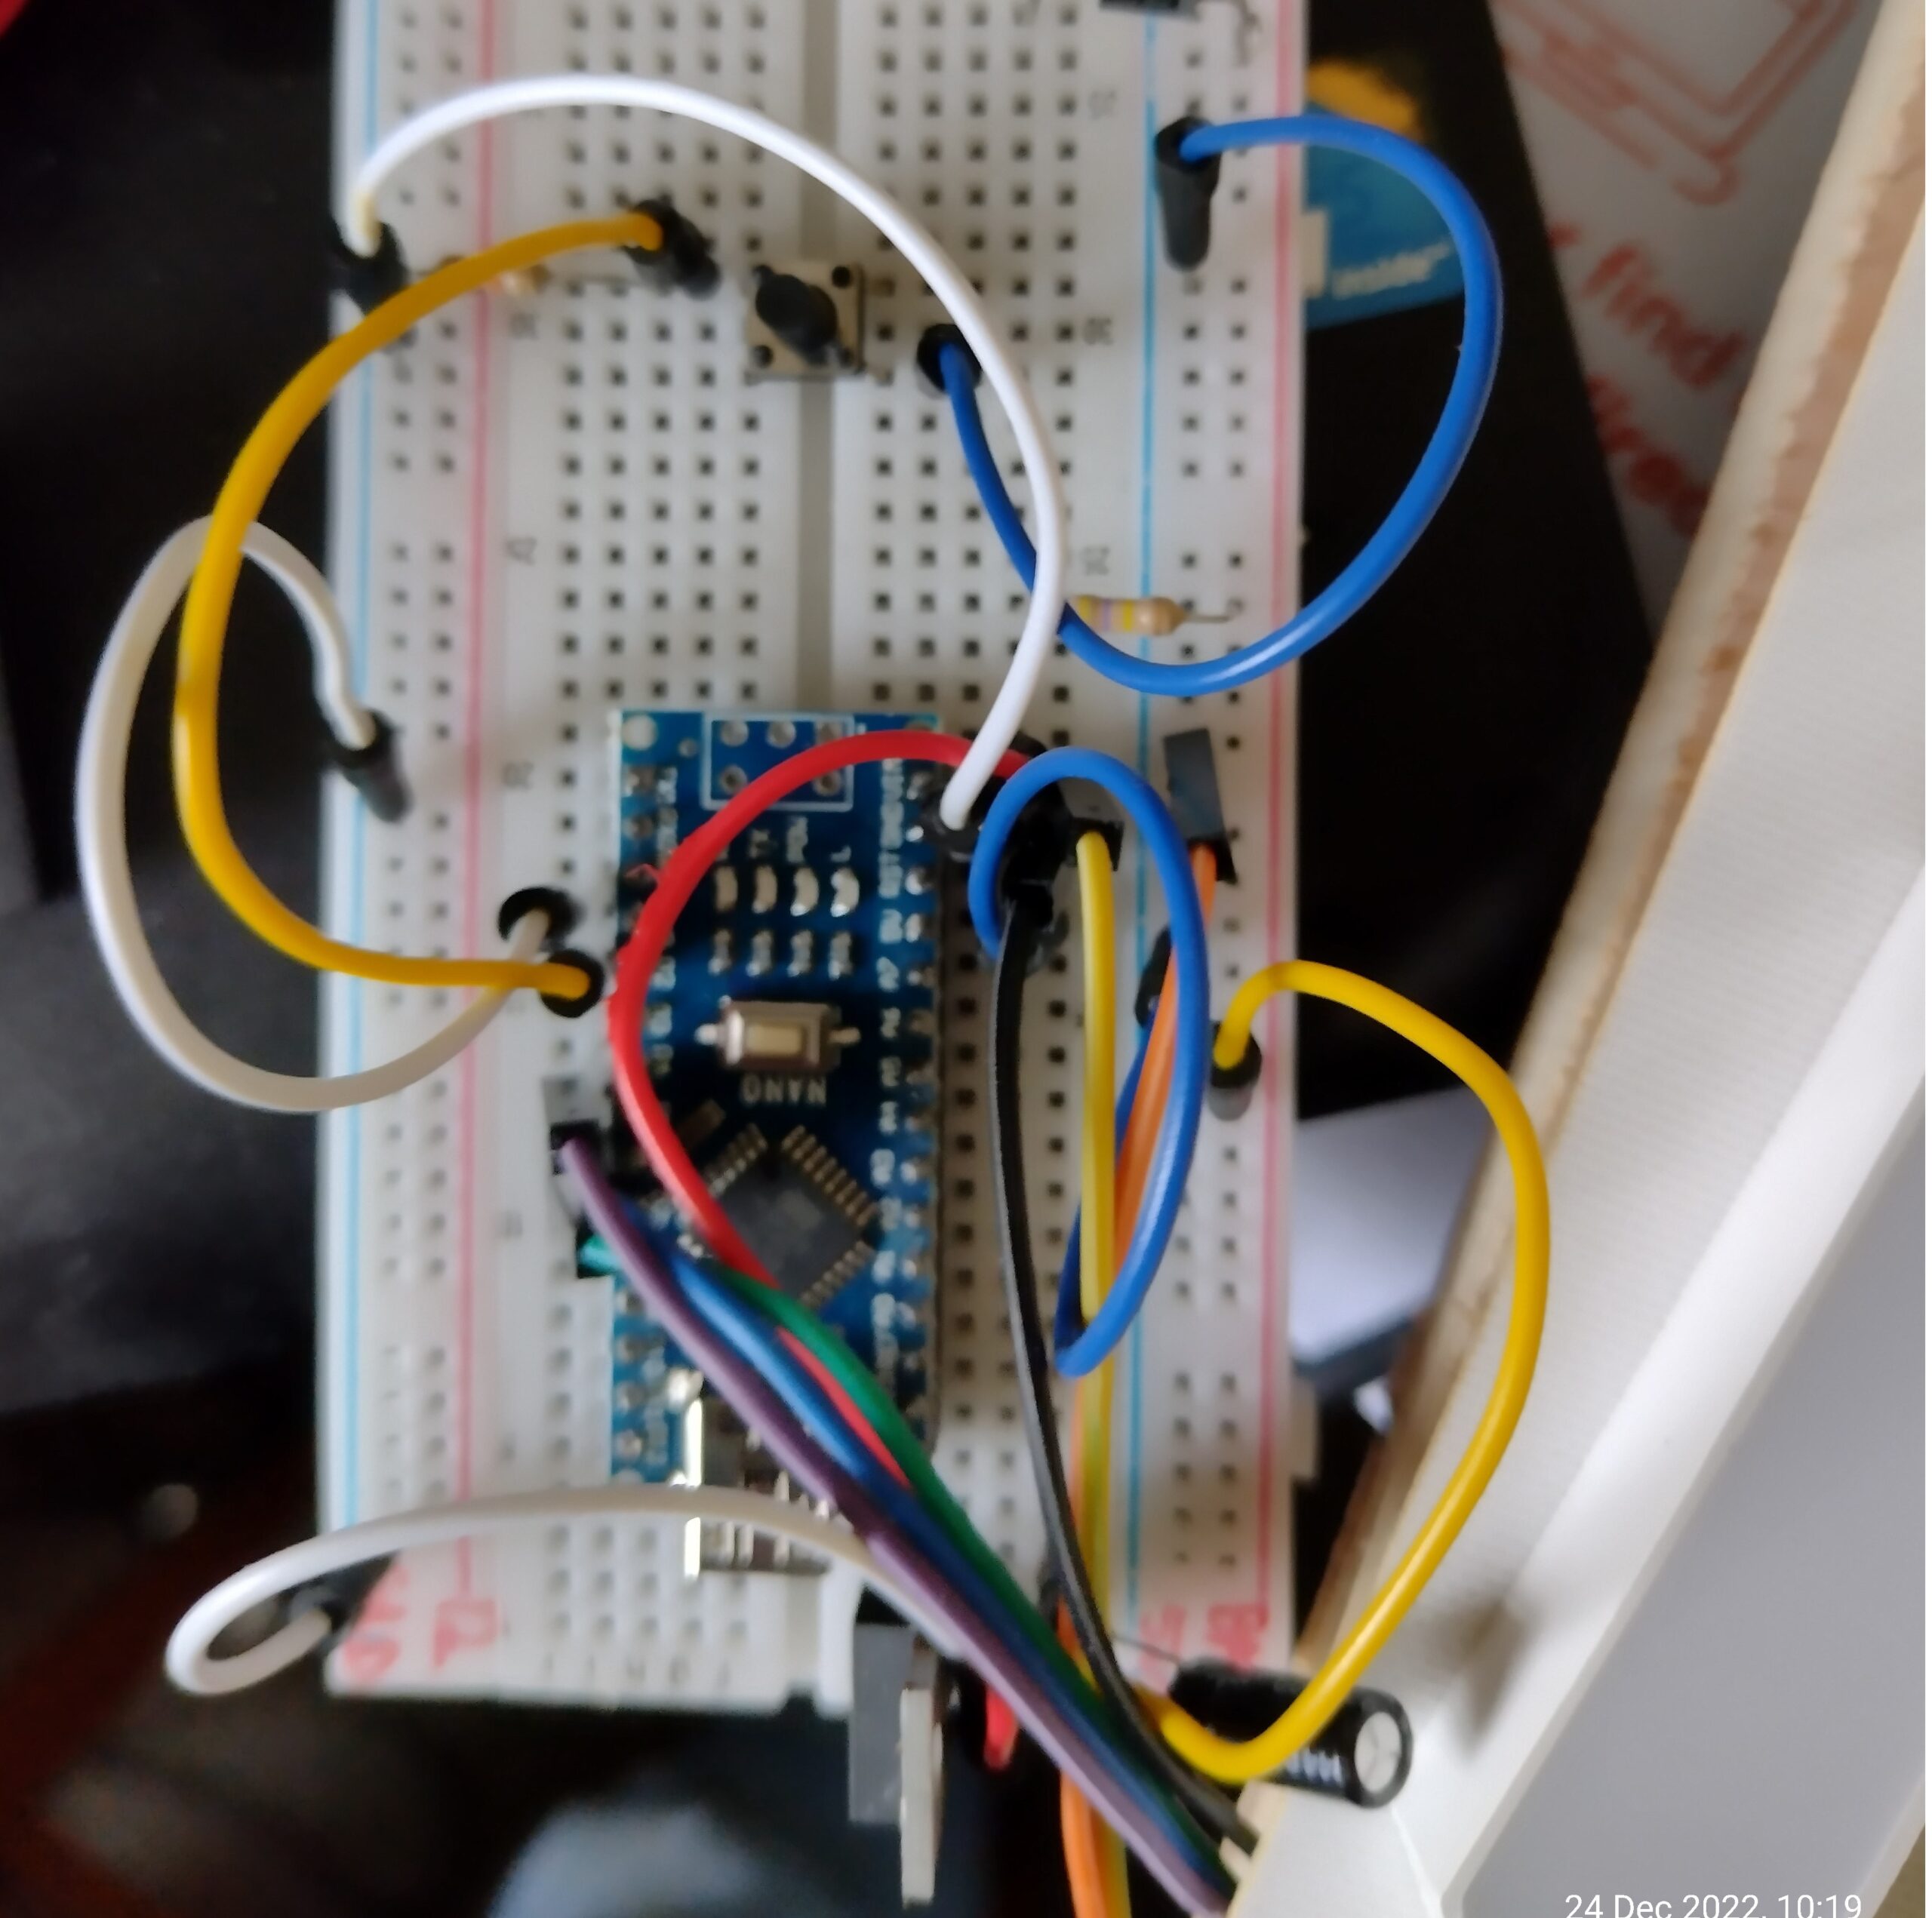
Then the remaining circuit for the speedometer was constructed on a breadboard, initially using no displays to check the speed calculations using the SerialMonitor in the Arduino software
The displays were then added, and the sample code from Sparkfun was loaded to the Arduino to test 2 displays, then I tweaked a few bits to get all 4 displays working
The speedometer code was uploaded, but it took a while to work out how the Sparkfun code worked, and even longer to work out how to get decimals to work.
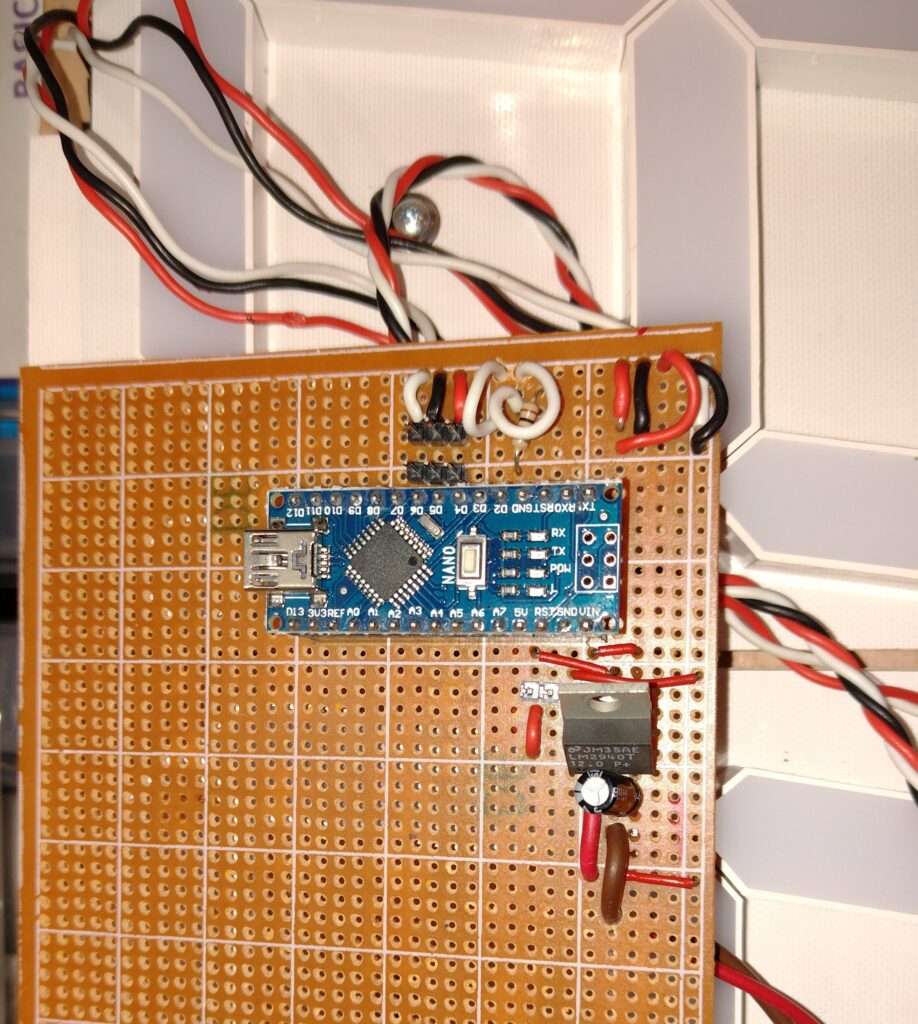
Second prototype
The circuit was built on Veroboard, using single core wires to make the necessary connection between the Arduino and the other components and voltage rails. I cut up and re-soldered servo extension leads for the connections to the drivers, switch and hall effect sensor.
The Arduino was held in header sockets and pins, for tidiness and to allow removal.
Testing
Initially I tested the circuit by randomly pressing the tactile button, and the values for speed seemed reasonable.
A week after completion I tried it in action, on the car track, but the sun meant the displays were not very visible. Removing the reverse-protection diode helped, so clearly the dropout of the diode and the regulator is too much and is therefore reducing the display brightness. I plan to rectify this by using three 6v batteries in series, to give 18v – well within the limits of the regulator, and will certainly be enough to eliminate issues with dropout.
That said, turning the display away from the sun made it more visible and the speed values seemed reasonable, with values remaining constant once the car got up to speed.
Below is the arduino code, free to download. Credit goes to sparkfun for the clever bits of the code. Remember I’m not a programmer – much of my coding is bad. You’ll need to rename the file to have a .ino extension to work in arduino